El Furniture Warehouse, multi-location group
$600k
annual labor savings
Found by rebuilding how the group measured productivity: moving from percentage of sales to output per hour worked.
Labor model rebuild, 90-day implementation
For restaurant operators ready to stop leaving money behind
Data-driven labor and menu advisory work for restaurant operators ready to stop guessing and start controlling their margins.
An example week at a full-service restaurant, scheduled the same way every day. Red hours had two or more people more than sales needed. Hover a cell to see it.
500+ restaurants advised on three continents. As much as $2M found in one engagement. A typical gain of 2–5 profit points, and 45 minutes to see where yours are.
Most operators we work with find 2 to 5 points in their labor model. Move the sliders to see that in dollars instead of percent.
One labor point, every year
$21k
The typical 2–5 point gain, every year
$42k–$104k
That’s the range. The Blueprint finds your real number, from your own sales and labor.
Every engagement starts with one conversation. Here’s what happened next.
El Furniture Warehouse, multi-location group
$600k
annual labor savings
Found by rebuilding how the group measured productivity: moving from percentage of sales to output per hour worked.
Labor model rebuild, 90-day implementation
A 30-unit casual dining group
257%
increase in profit per unit
After standardizing their labor framework, eliminating the margin leakage of every manager running a different model.
Scale-ready systems, 30 locations, 120-day rollout
A 30-unit Vancouver group
$2M
in recoverable annual margin
Added through combined labor and menu engineering, without touching prices or staffing levels.
Labor and menu engineering, results in 60 days
The Labor Profit Blueprint
This isn’t a discovery call. It’s a working session. You’ll leave with a specific dollar figure and a roadmap to capture it.
Send us your last 3 months of sales and labor by unit. Takes 10 minutes. We work with whatever your POS or payroll system exports.
We plug your numbers into our model live. You’ll see exactly where 2–5 profit points are hiding, and why your current approach is missing them.
You get a written implementation roadmap ranked by impact. If there’s a fit to work together, we’ll discuss it. Either way, you leave with something real.
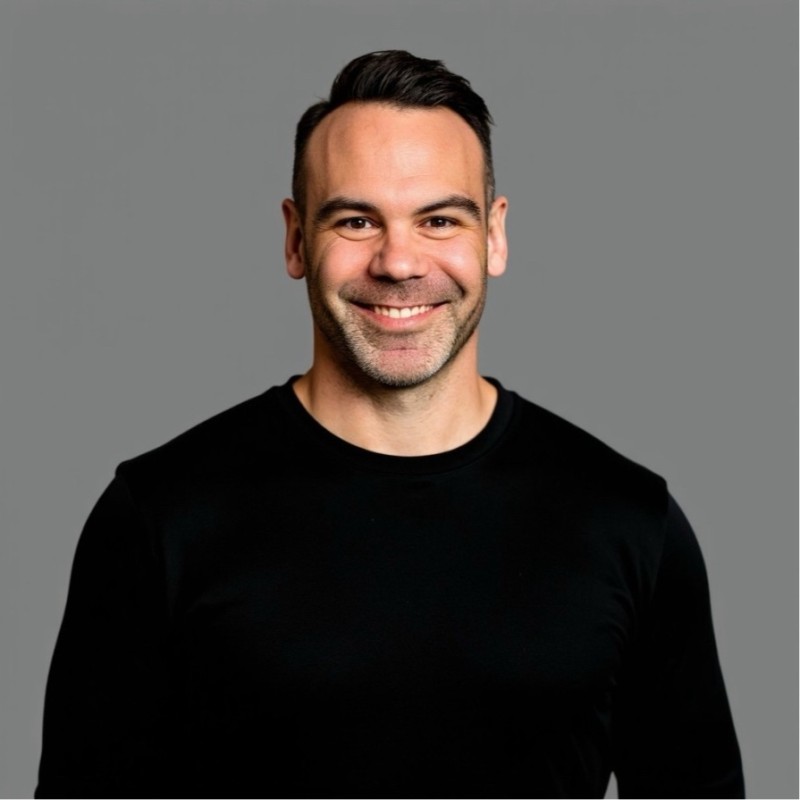
Jim built Benchmark Sixty after spending years on both sides of the restaurant P&L: as an operator, and as the person other operators called when the margins wouldn’t move.
The problem was almost always the same. Operators were measuring labor as a percentage of sales, which tells you how big your payroll is relative to revenue. It doesn’t tell you whether your team is productive. That gap is where the profit disappears.
He has advised 500+ restaurants across North America, Australia and Europe, speaks at Restaurants Canada’s annual RC Show, and has written two books on the methodology behind Benchmark Sixty.
“Jim helped us rethink how we look at labor entirely. Learning to track based on productivity versus a percent transforms how you forecast scheduling and monitor management effectiveness. I highly recommend Jim to any operator looking to set up best labor practices.”
One 45-minute working session. A specific dollar figure. A plan to capture it. No commitment.